











Artificial Intelligence (AI) & Data Analytics
- Client
- In House Product
- Category
- Data Visualization / Business Intelligence
Project Summary
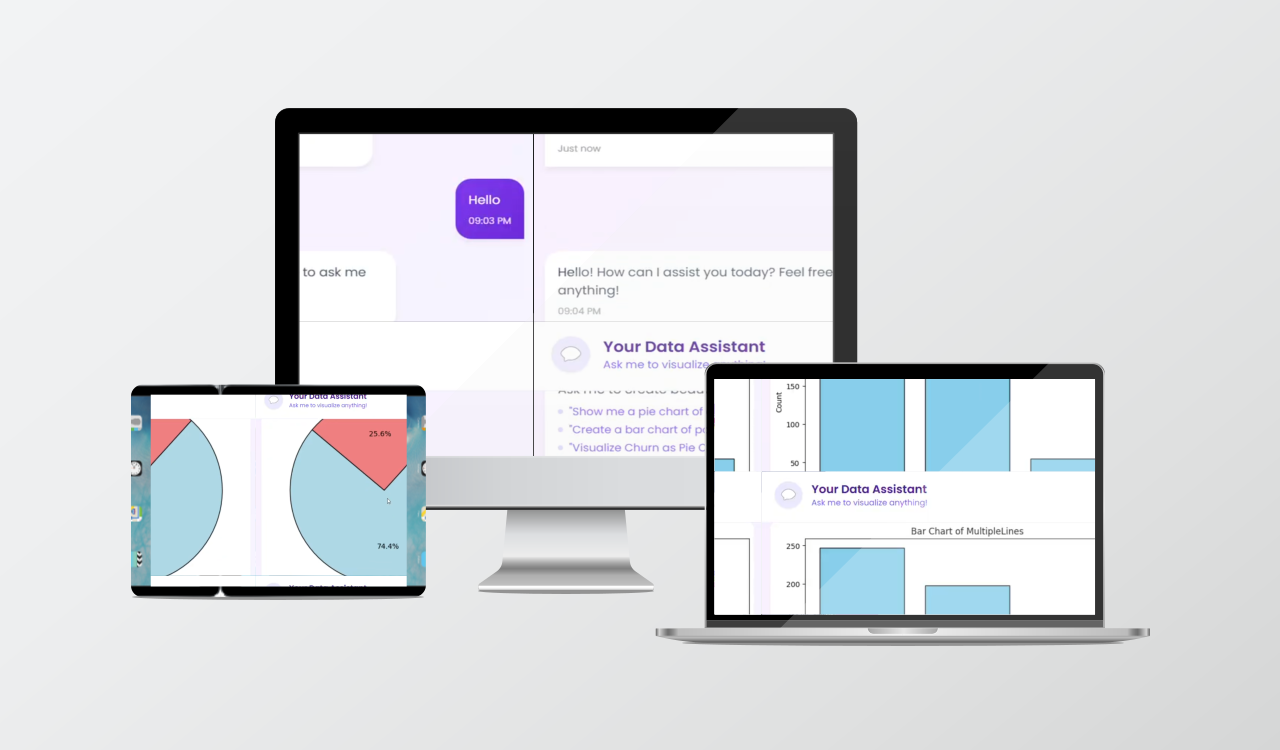
This project is an AI-powered Data Visualization Assistant that allows users to generate insightful charts and graphs instantly through natural language interaction. By simply asking questions or requesting specific visualizations (e.g., pie charts, bar graphs), users can transform raw data into clear and interactive visual outputs. The assistant helps businesses, analysts, and non-technical users quickly understand data without needing complex tools or coding skills.
Project Features
- AI Chat Interface – Users can type queries in natural language to request visualizations.
- Dynamic Data Visualization – Supports pie charts, bar charts, and other visual representations.
- Cross-Device Accessibility – Optimized for desktops, tablets, and mobile devices.
- Instant Insights – Provides real-time conversion of data into visual reports.
- Customizable Views – Ability to adjust chart types and formats based on user needs.
- User-Friendly Experience – No technical knowledge required; just ask and visualize.
--------------------
LET’S CREATE!
--------------------
LET’S CONNECT!
--------------------
LET’S CONNECT!
LET’S CONNECT!
--------------------
LET’S CONNECT!
--------------------
LET’S CONNECT!
--------------------


